Plausible but Not Valid — A Gaussian Copula Is a Better Survey Respondent Than Any LLM
Thirty-seven models fill in a validated Lithuanian organisational-psychology battery as personas, and a statistical sampler with no language model in it reproduces the human response structure better than any of them.
Background
Running a survey is slow. A typical organisational-psychology study recruits a few hundred people over several months, and each one costs consent paperwork, ethics review, translation, and panel fees. So a large literature has grown up around asking a language model to answer as a person with a given demographic profile, and treating the output as data. Argyle and colleagues introduced the silicon-sample framing and showed that GPT-3 could reproduce the marginal direction of several US political-attitude contrasts. Horton replicated behavioural-economics experiments with model agents, Aher and colleagues replicated canonical psychology experiments, and Dillion and colleagues argued outright for language models as substitutes for human participants in moral psychology.
A second literature pushes back. Santurkar and colleagues found that GPT-3.5 reflects a narrow slice of US opinion, closest to a moderate Democrat. Durmus and colleagues extended the finding to multinational surveys and reported a skew toward Western, English-speaking, urban populations. Bisbee and colleagues showed that synthetic samples can match human means and still diverge on marginal effects. What both literatures share is the unit of analysis. They evaluate single items, one or two demographic contrasts, or an aggregate effect size for one hypothesis.
Psychometrics asks a stricter question. A scale is a valid measurement only if its items co-vary the way the construct predicts, if they load onto the latent factor they are supposed to load onto, if the resulting score is stable on re-administration, and if it relates to other constructs as theory says it should. A model that reproduces item means has believable item means. It does not thereby have a believable respondent. The distinction matters downstream. A synthetic respondent with correct item means and incorrect item covariance inflates Type I error in any analysis that conditions on a multi-item scale score. A synthetic respondent with correct subscale means and incorrect inter-subscale correlations breaks any mediation model that touches two constructs at once.
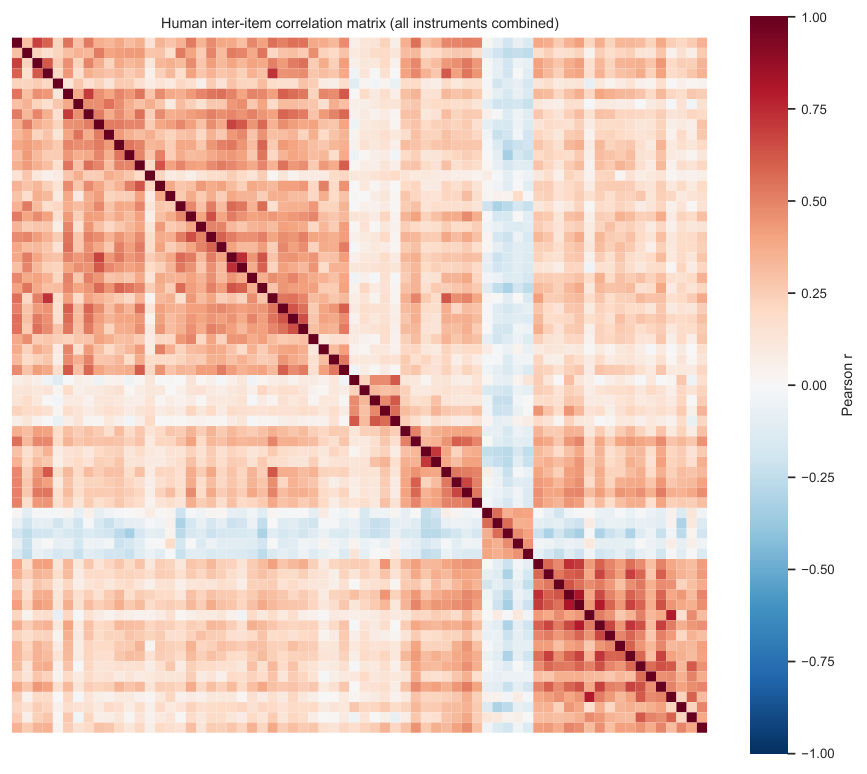
The choice of dataset is doing real work here. Nearly every benchmark of this kind uses US or UK instruments in their original English wording, which conflates two questions that ought to stay separate. One is whether the model reproduces the joint distribution of a real human sample. The other is whether it reproduces the joint distribution of the population whose text its weights absorbed. A Lithuanian sample separates them. Lithuanian has under three million native speakers, a rich case morphology, and a diacritic-heavy orthography, so current models handle it competently without being at home in it. The three international instruments were developed in English and Dutch and then translated, which makes their published factor structure and reliability external constraints that English-language pretraining cannot supply.
Core Idea
The proposal is an evaluation harness rather than a model. Each pairing of a model with an experimental condition produces a hundred synthetic questionnaires, and those are scored on six psychometric dimensions against the human reference. Five of the six aggregate into a single Psychometric Similarity Score on the unit interval:
with weights of 0.25 on distribution, 0.25 on correlation, 0.20 each on reliability and mediation, and 0.10 on demographic effects. Read left to right, the terms ask whether the per-item response distributions match, whether the 68×68 item correlation matrix matches, whether Cronbach’s lands near the human value on each subscale, whether the study’s mediation pathway is recovered at the right magnitude, and whether demographic group differences point the right way at roughly the right size.
The idea that makes the paper land is not the score itself. It is what the score is measured against. Five generators with no language model in them supply a floor, and a held-out split of the human sample supplies a ceiling. Without those anchors, a leaderboard of 37 models tells you which model wins. With them, it tells you whether winning means anything.
Method
The human reference
The ground truth is a published Lithuanian master’s thesis by one of the authors, collected from 263 employees in March and April of 2020 under the awarding university’s consent protocol. The timing is not incidental. Collection coincided with Lithuania’s first nationwide COVID-19 lockdown, so attitudes toward organisational change were unusually salient and the resulting variance is unusually informative.
Four instruments make up the 68 items and 12 subscales. The Individual Work Performance Questionnaire contributes 18 items across task performance, contextual performance, and counterproductive behaviour. Dunham’s Attitudes Toward Change contributes 18 items across cognitive, affective, and behavioural subscales. The 17-item Utrecht Work Engagement Scale contributes vigour, dedication, and absorption. A 15-item change-engagement scale built by the original author from a literature review is deliberately the weakest of the four, and it earns its place as a control. A construct-fidelity metric that cannot tell a well-validated instrument from a homemade one is not measuring construct fidelity.
The human sample carries three reference facts that the whole audit hangs on. The attitudes-to-engagement-to-performance mediation is significant, with an indirect effect of and a bootstrap interval of . The managerial versus non-managerial role contrast is significant, at between 0.39 and 0.65 across composites. The gender contrast is null on every composite, at . That last one is the most useful, because it converts any gender effect the models produce into evidence of fabrication rather than amplification.
Persona conditioning
Models never see a human’s item responses. They see a profile card and an instruction. How much of the card they see is the first experimental factor, and it runs up a five-rung ladder. C0 discloses nothing and asks the model to answer as a generic Lithuanian employee. C1 adds gender and age, the two primes the persona literature uses most. C2 adds role and education. C3 discloses all eleven profile fields and is the headline condition. C4 appends a free-text sentence describing the organisational change the respondent actually reported. A sixth variant, C9, renders the C3 content as a prose paragraph instead of structured fields, which isolates surface form from field content.
The prompt itself is deliberately uninformative about the study. A system message pins JSON-only output. The user message supplies the persona in Lithuanian, the response anchors, the numbered items in published order, and an instruction to use the full Likert range without social-desirability adjustment. Subscale membership, construct labels, and hypotheses are all withheld. The anti-social-desirability line is there because pilot runs found several models parking on the scale midpoint, which deflates both the standard deviation and the inter-item correlations.
Three further factors vary. Presentation mode splits the questionnaire into one call, three calls, or twelve. Reasoning effort is minimal for the headline grid and ablated on six models. Language is Lithuanian for the headline runs and English for a matched ablation on the same profiles.
The six dimensions
Distribution is per-item Jensen–Shannon divergence against the human Likert distributions, reported alongside the within-item standard-deviation ratio. The ratio gets its own line because range restriction is the most common failure mode and divergence alone will not flag it. Correlation is the upper-triangle similarity between the model’s 68×68 item correlation matrix and the human one. Reliability is scored as the absolute gap in Cronbach’s rather than as a ratio, which is the right choice. A model whose exceeds the human value is not doing better. It is answering too consistently.
Mediation scores sign match on each path, magnitude error on the indirect effect, and whether both bootstrap intervals exclude zero. Demographic effects score direction match, magnitude amplification, and a false-positive rate on contrasts that are null in humans. Construct fidelity sits outside the aggregate and is reported separately, because a model can post a strong item-level score with no recoverable latent structure underneath it.
The construct-fidelity metric carries a methodological correction worth flagging on its own. Tucker’s congruence coefficient compares a model’s factor loadings to the human ones after a greedy search for the best column alignment, and that search biases the statistic upward. Even random loadings can align by chance, especially on instruments with many items per factor. So the authors permute the item labels of the model’s loading matrix 500 times, recompute each time, and read the observed value against that null. A value inside the null distribution does not count as preserved structure, whatever its raw magnitude.
The anchors
Five non-LLM generators bracket what is achievable without a language model. Marginal samples each item independently from its empirical distribution, which maximises the distributional component and destroys correlation. MVN fits a multivariate Gaussian to the standardised responses and rounds back to valid Likert levels, preserving the covariance structure. Gaussian copula fits per-item marginals plus a Gaussian dependence structure, so it keeps both the marginals and the rank correlations. Stratum mean returns the rounded demographic-stratum mean, which by construction has the correct between-group differences. Nearest-neighbour lookup averages the responses of the five most demographically similar real respondents.
The copula is the one that matters. It is the strongest combined distribution-and-correlation generator available with no language model in it, so a model that fails to beat it on those components is contributing nothing the human covariance structure did not already contain.
The ceiling comes from an 80/20 stratified split of the human sample. The training half re-derives the reference statistics and the held-out half plays the part of the synthetic respondent. The resulting PSS of 0.825 is what a perfect simulator could actually reach at this sample size, given that the reference statistics themselves are estimated with noise.
Experiments
The headline grid covers 37 models from OpenAI, Anthropic, Google, and twelve open-weight families, at 100 stratified respondents per cell, for roughly 65,000 validated questionnaires.
| Generator | PSS | Distribution | Correlation | Reliability | Mediation | Demographic |
|---|---|---|---|---|---|---|
| Held-out human ceiling | 0.825 | 0.981 | 0.762 | 0.986 | 0.720 | 0.480 |
| baseline-mvn | 0.702 | — | 0.950 | 0.994 | 0.995 | 0.664 |
| baseline-copula | 0.688 | — | 0.954 | 0.986 | 1.000 | 0.522 |
| baseline-stratum | 0.342 | — | 0.169 | 0.336 | 0.805 | 0.714 |
| baseline-marginal | 0.195 | — | 0.011 | 0.097 | 0.667 | 0.395 |
| gpt-5.4-mini (best model) | 0.714 | 0.589 | 0.522 | 0.939 | 0.986 | 0.512 |
| minimax-m2-7 | 0.703 | 0.779 | 0.414 | 0.822 | 0.940 | 0.520 |
| deepseek-v4-pro | 0.701 | 0.778 | 0.380 | 0.763 | 0.985 | 0.618 |
| 37-model ensemble mean | 0.305 | — | 0.374 | 0.912 | 0.000 | 0.291 |
| grok-4-20 (worst model) | 0.341 | 0.660 | 0.348 | 0.063 | 0.153 | 0.455 |
The aggregate column is the least interesting one. The best model edges past both baselines, by 0.012 over MVN and 0.026 over the copula, against a bootstrap confidence interval of average width 0.046. Read the components instead. On correlation the copula scores 0.954 and the best model 0.522, with the median model at 0.37. On reliability the copula scores 0.986 and the best model 0.939. Two generators that know nothing about Lithuanian organisational psychology reproduce the human item dependency structure roughly twice as faithfully as the strongest of 37 language models.
Three follow-up analyses close off the obvious escapes. The first answers a fairness objection. The copula sees human item responses while the model sees only an eleven-field profile, so the authors fit a demographic-conditional copula that ridge-regresses each item on those same eleven fields and fits the dependence structure on the residuals. It raises the low-weight demographic component and nothing else, and its in-sample gain evaporates under five-fold cross-validation, landing at 0.680. The profile the model conditions on adds no measurable psychometric signal to a statistical generator.
The second is a discriminator. A classifier trained to separate synthetic respondents from real ones scores an AUC of 0.39 on the copula and 0.52 on MVN, which is chance or worse. Against the language models it scores a median AUC of 0.999. The generators that win the psychometric comparison are also the ones that are statistically indistinguishable from humans, and every model in the lineup is trivially detectable.
The third is a sample-size sweep. The copula climbs from 0.69 at ten respondents to 0.82 at two hundred. The best model plateaus near 0.62 by about fifty and stays there. The gap widens from 0.11 to 0.19 as more synthetic respondents are drawn, so drawing a bigger synthetic sample makes the comparison worse rather than better.
Conditioning helps, and then stops helping. Moving from C0 to C3 improves PSS by 0.18 on average, and by as much as 0.58 on deepseek-v4-pro and qwen3-7-plus. Two models barely respond to the profile at all. Adding the C4 change narrative on top of C3 moves the mean by −0.001, well inside the confidence interval. The narrative C9 rendering shifts PSS by a median absolute 0.06 and correlates with the C3 ranking at a Spearman of only 0.31, which is a warning against reading small rank gaps as real.
Factor structure holds on one instrument and dissolves on the others.
| Instrument | Mean φ | Mean null φ | Models rejecting H₀ |
|---|---|---|---|
| IWPQ (work performance) | 0.821 | 0.373 | 32 / 37 |
| UWES (engagement) | 0.866 | 0.771 | 29 / 37 |
| Dunham ATC (attitudes) | 0.549 | 0.385 | 29 / 37 |
| ChangeEng (auxiliary scale) | 0.458 | 0.301 | 22 / 37 |
The UWES row is what justifies the permutation machinery. Its raw congruence is the highest of the four and its null is almost as high, because a 17-item three-factor structure produces large congruences by chance. Eight models land inside the chance distribution with raw values as high as 0.856, which the conventional 0.85 threshold would have certified as identical structure. The leaderboard winner is among the models that fail here, on two instruments out of four. A strong item-level score does not carry a recoverable latent structure with it.
The discriminant-validity numbers point the same way. Human data violates the HTMT < 0.85 criterion on 4 of 12 subscale pairs. Model data violates it on 7.7 of 12 on average, and a bifactor decomposition shows models inflating the general-factor variance share by 0.08 to 0.13 while collapsing the specific-factor reliability of the attitudinal scales. Constructs that humans keep distinct get folded onto a single evaluative axis.
The authors read two mechanisms out of the response logs. Under persona collapse, a detailed persona is treated as one coherent direction, so a model that has decided its persona is conscientious applies that direction across subscales that overlap in surface wording. Under anchor reuse, a model that settles on a Likert value early in a call reuses it on later items that share lexical features, whatever construct those items belong to. Both effects are strongest in single-call mode and partly suppressed when the questionnaire is split up.
Stereotype amplification is universal and wildly asymmetric. Swapping exactly one profile field and re-running gives a paired effect size whose noise floor, estimated from test–retest repeats, is about 0.09.
| Swapped field | Mean |d| | Max |d| | Human reference |
|---|---|---|---|
| Education (higher ↔ secondary) | 0.563 | 1.499 | not supported at this magnitude |
| Role (managerial ↔ not) | 0.176 | 0.496 | significant, |d| 0.39–0.65 |
| Gender (woman ↔ man) | 0.119 | 0.498 | null on every composite |
Education dominates everywhere. Every model in the lineup shows a non-zero education effect on every subscale, and the largest single effect is a 1.5-standard-deviation shift in self-rated contextual performance from changing one word on the profile card. The role effect is real in humans and reproduced at roughly 0.4 times the human magnitude. The gender axis is the interesting negative. The aggregate sits just above the noise floor, only seven models exceed 0.15, and the authors decline to call it a universally fabricated stereotype. What survives is the ordering. Education dominates role, role dominates gender, and no model reverses it.
The authors offer three candidate mechanisms and settle none of them. Pretraining corpora may over-represent English-language HR writing that treats education as a strong predictor of work attitudes. The education field may be a single short token that anchors more strongly than the multi-word role field. Or education may be entangled with role and sector in the model’s prior, so swapping it swaps several correlated covariates at once. The practical implication survives the ambiguity. A bias audit that reports one amplification number averaged across axes is reporting a number whose value depends entirely on which axes it happened to include.
Memorisation is ruled out. A two-form recall probe asks each model to reproduce item text from its identifier, and again with the previous item shown verbatim. The worst high-recall rate across all 37 models is 4.7%, 22 of them score exactly zero, and the rank correlation between recall rate and PSS is 0.00. Three response patterns show up in the logs. The GPT and Claude families mostly refuse outright. Several Gemini and open-weight models confabulate fluent Lithuanian text that is not the published item. One model leaks English reasoning about the IWPQ’s structure, revealing familiarity with the instrument family without the Lithuanian wording. Paraphrased exposure to the English originals remains possible, and the leaderboard is still not explained by memorised Lithuanian items.
The crowd is more like itself than like us. The 37×37 inter-model PSS matrix averages 0.733 off the diagonal. The best model’s similarity to humans is 0.714. Models resemble each other more than the best of them resembles a human sample, and hierarchical clustering on the distance matrix recovers vendor boundaries, with Anthropic the tightest cluster at 0.78. The ensemble makes this concrete. Averaging all 37 models produces a PSS of 0.305, below every individual model and below every baseline except the marginal sampler, because averaging strips out the per-model persona signal while leaving the shared error in place. The wisdom-of-crowds intuition inverts here.
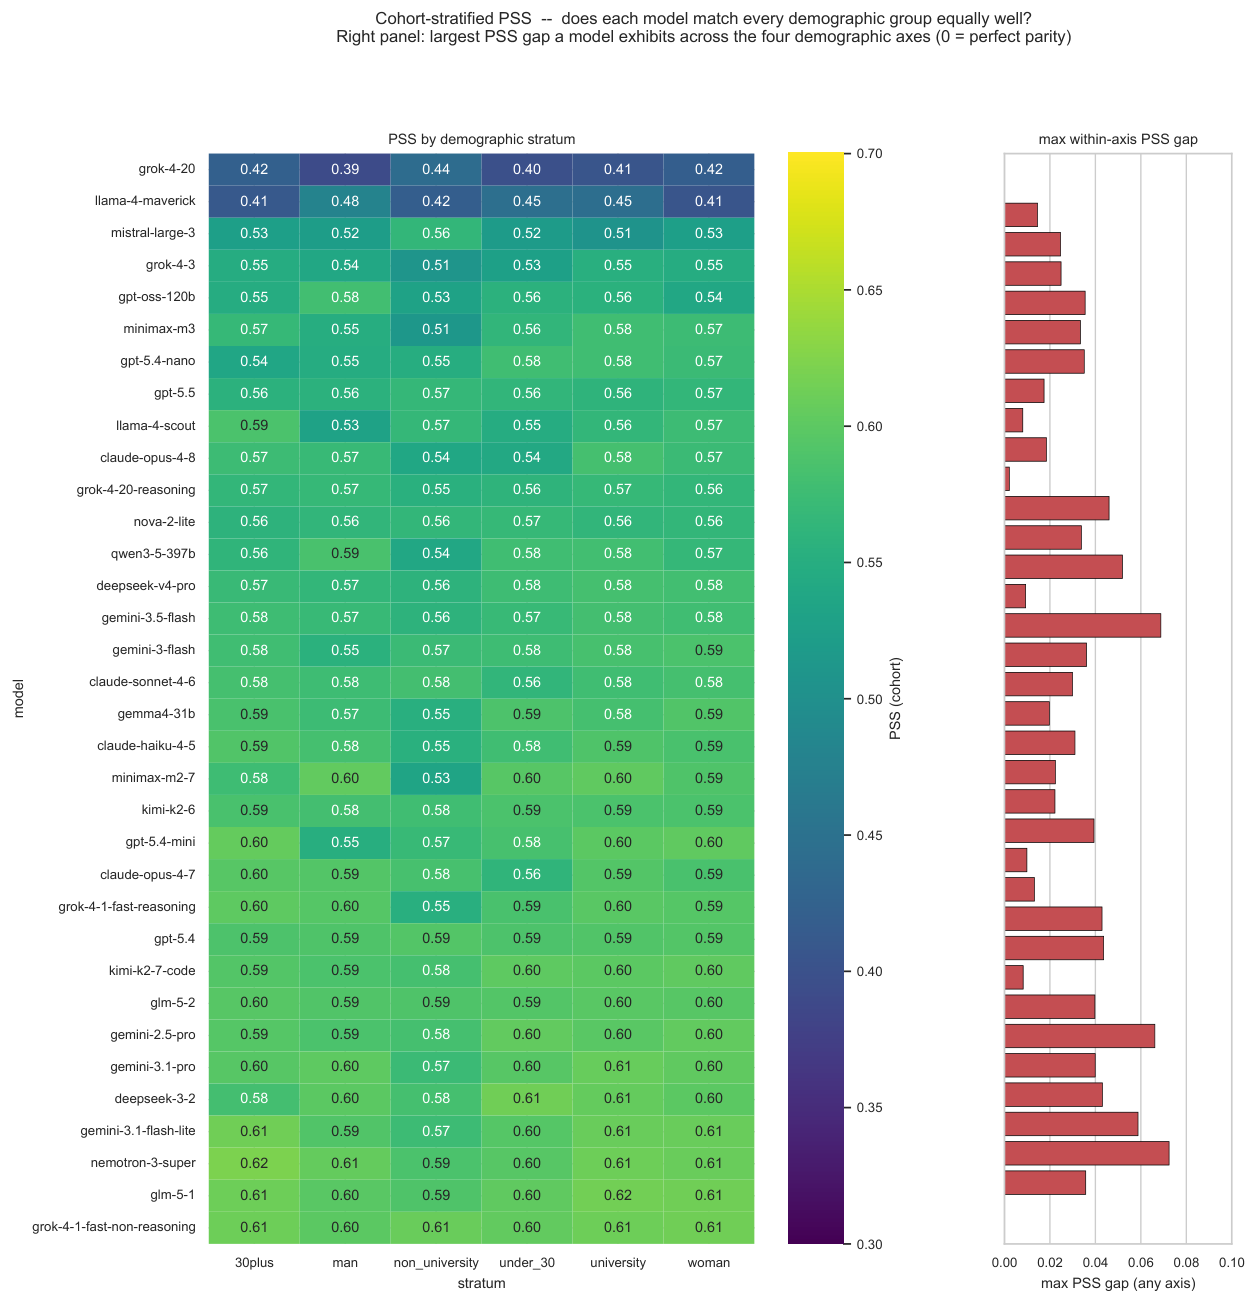
Four ablations bound the design. Higher reasoning effort moves only two of six tested models beyond the noise floor and does not uniformly improve fidelity. English versus Lithuanian wording on matched profiles drifts by 0.26 Likert points with a per-item correlation of 0.889, and the direction of the small advantage splits by vendor. Fragmenting the questionnaire into twelve calls degrades persona consistency badly, up to an effect size of 1.20 on one model, while improving discriminant validity for the same reason. Cohort-stratified scoring finds worst-case within-axis disparities of 0.072 on gender and 0.069 on education, which exceed the aggregate gap between neighbouring leaderboard rows.
What the substitution actually costs. Three diagnostics translate the fidelity gaps into consequences. On response style, almost every model shifts toward agreement by 0.84 standard deviations relative to humans, under-uses the endpoints by 0.23, and over-uses the midpoint by 0.12. On predictive validity, a ridge regressor trained on human respondents predicts a held-out human composite at , while the same regressor trained on synthetic respondents averages on the same human test set. That is worse than predicting the mean, and one model out of 37 stays near human-level utility. On causal structure, a placebo battery of ten mediation paths that are null in humans returns a significant indirect effect on three of them. The mediation pathway that models do recover is therefore partly reconstructed and partly confabulated.
Limitations
The scope conditions are narrow and the authors say so. One Lithuanian sample of 263 employees, one construct family, one collection window that happened to coincide with a national lockdown. The six PSS dimensions generalise to any Likert instrument, and whether the specific failure modes do is an open question. Personality inventories, clinical depression scales, and political-opinion batteries would each stress a different assumption, and none has been run.
The reference is self-report, which leaves one comparison permanently ambiguous. Models over-report self-rated work performance, and so do humans. The IWPQ literature documents a social-desirability bias on the task-performance subscale, and the reference inherits that bias with no way to net it out of the gap.
Instrument leakage is bounded rather than excluded. The memorisation probe rules out verbatim recall of the Lithuanian wording convincingly. It cannot rule out that a model has read the English Koopmans paper and is applying construct-level knowledge to translated items. The benchmark therefore tests performance on a translated public instrument, and leaves performance on a genuinely novel one for a follow-up.
Two design choices are pinned for cost. Headline cells use a hundred respondents and a single repeat, so the confidence bands sit comfortably below the leaderboard’s overall spread and comparable to the gaps inside the top five. Reasoning effort is minimal throughout. The reasoning ablation suggests this matters for two models out of six, which leaves the headline conclusions intact and the fine-grained ranking soft.
Finally, the counterfactual result is an algorithmic finding rather than a deployment finding. The audit documents an asymmetry in bare models under a controlled prompting protocol. Whether a production pipeline inherits it depends on that pipeline’s prompt structure, retrieval, post-processing, and human review. The honest reading is that the asymmetry is present in the base model, and any deployment that does not actively correct for it will carry it forward.
References
- Original paper: Plausible but Not Valid: A Psychometric Audit of LLMs as Synthetic Survey Respondents
- Human reference dataset: Šarkauskaitė (2020), Lithuanian organisational-psychology thesis, released with the benchmark under CC-BY-NC-4.0
- Silicon samples: Argyle et al. (2023), Political Analysis 31(3); Horton (2023), arXiv:2301.07543; Aher et al. (2023), ICML; Dillion et al. (2023), Trends in Cognitive Sciences
- Limits of synthetic respondents: Santurkar et al. (2023), Whose Opinions Do Language Models Reflect?, ICML; Durmus et al. (2024), Towards Measuring the Representation of Subjective Global Opinions; Bisbee et al. (2024), Political Analysis; Wang et al. (2025), Large Language Models Cannot Replace Human Participants
- Instruments: Koopmans et al. (2014), IWPQ; Dunham et al. (1989), Attitudes Toward Change; Schaufeli and Bakker (2004), UWES-17
- Psychometric machinery: Cronbach (1951); McDonald (1999); Hayes (2018), mediation with bootstrap intervals; Tucker (1951), congruence coefficient; Cheung and Rensvold (2002), ΔCFI invariance
- Related coverage in this series: Hierarchical Persona (persona flattening under trait conditioning); PersonaTree (long-horizon persona collapse)